Smart Dashboards & KPIs for Efficient Logistics
Dashboards & KPIs | Gain Full Control Over Your Supply Chain
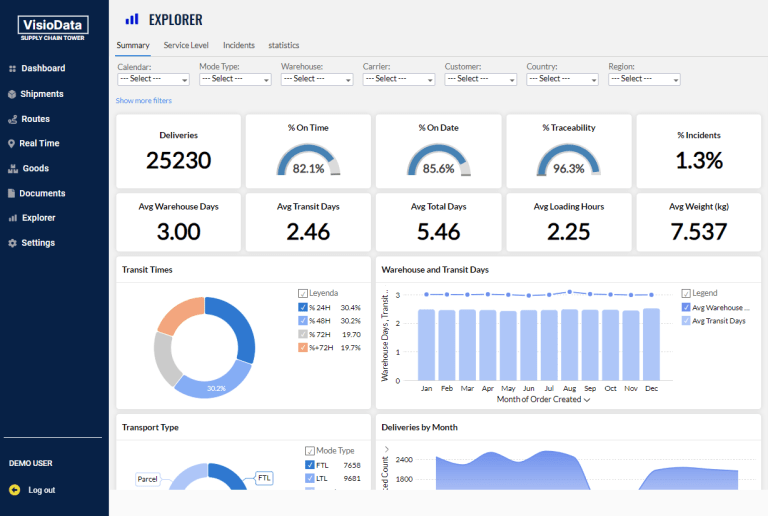
Efficient supply chain management requires accurate, actionable data. With VisioData’s Dashboards & KPIs, you can:
- Visualize real-time information
- Analyze trends & logistics performance
- Optimize transport & distribution operations
Make data-driven decisions and stay competitive in the logistics industry.
How Dashboards & KPIs Improve Your Logistics
Continuous Optimization
- Identify areas for improvement in your transport or distribution network.
- Optimize operations with real-time data.
Data-Driven Decision-Making
- Access accurate, updated metrics for strategic decision-making.
Cost Reduction & Higher Profitability
- Minimize operational costs and optimize delivery times for better efficiency.
Greater Transparency & Trust
- Share key metrics with clients & carriers to enhance communication and trust.
Key Features of Dashboards & KPIs
Analytics Panels
- On-Time Delivery Tracking – Monitor delivery punctuality, transit times, and carrier performance.
- Incident & Delay Identification – Analyze causes of disruptions by route & carrier to prevent future delays.
- Shipping Cost Optimization – Control logistics costs based on distance, volume & number of deliveries.
- Logistics Trends & Performance – Track shipment evolution, order volumes, and transport efficiency.
Total System Connectivity
- Connect ERP/TMS data & external sources to enrich analytics and create independent dashboards.
Advanced Business Intelligence
- Segmentation & Filters – Sort data by date, carrier, customer, or geographic area for detailed analysis.
- Historical & Comparative Analysis – Compare activity periods to identify patterns and optimize logistics.
- Intelligent Notifications – Set up automatic alerts to detect deviations in KPIs & performance issues.
- Multi-Format Data Export – Convert dashboards into Excel, PDF, or image files for internal reports or client presentations.
Full Integration with VisioData
Connected Dashboards Across Your Supply Chain
Combine real-time tracking, eCMR, and traceability data for a consolidated logistics view. Integrate data from your own systems & files for deeper insights.
AI-Powered Optimization
AI-driven dashboards to detect patterns, predict trends, and optimize workflows
Complete Shipment Visibility in Dashboards
Integrate real-time tracking data for full shipment & carrier control
Digital Document Integration in Dashboards
Link eCMR data with shipment events & delivery tracking
CO₂ Emissions Calculation
Incorporate carbon footprint data to track emissions & support sustainability initiatives